Student projects
Mapping the Pandemic – students create web apps to visualize COVID-19 data
Students in the winter session course E&ES271Z Mapping the Pandemic spent two and a half weeks critically evaluating existing maps and apps related to the current pandemic, learning how to use ArcGIS Online to analyze and visualize data spatially, and creating their own maps and apps. See below for a sampling of the story maps … Read more
Wesleyan student story maps document their COVID-19 experiences
Some students in the Spring 2020 QAC 231 Introduction to Geospatial Data Analysis and Visualization course chose to do their story maps assignment on their COVID-19 experiences: https://storymaps.arcgis.com/stories/0dbe4ba1f30947ada0573a62a2693cdb https://storymaps.arcgis.com/stories/51ae4e73b5374144823e6584ece8cb77 https://storymaps.arcgis.com/stories/310a4a06b4ef4753ad17941af7661e19 https://storymaps.arcgis.com/stories/477fb3b8b3384c09bbf5a6ab11d1989b https://storymaps.arcgis.com/stories/a4a1fbc10377473292d77bc38db5db81 Some of the story maps are not public. If the app asks for log in info, click Enterprise, type Wesleyan in the box, … Read more
Wesleyan students create COVID-19 geoapp for the NYC Commuting Region
A former and a current GIS Assistant (Grant van Inwegen and Jesse Simmons) used ArcGIS Online to help create a regional view of the NYC COVID-19 outbreak. Here is an excerpt from the Traveler’s Lab blog post at https://travelerslab.research.wesleyan.edu/2020/04/27/covid-19-in-nyc/. The Traveler’s Lab at Wesleyan University studies the movement of people and objects during the middle ages. … Read more
Wesleyan students use GIS skills to help solve environmental problems and crime
Click post title to read about the Fall 2019 GIS Service Learning projects.
Diver presents at CT GIS Day 2019
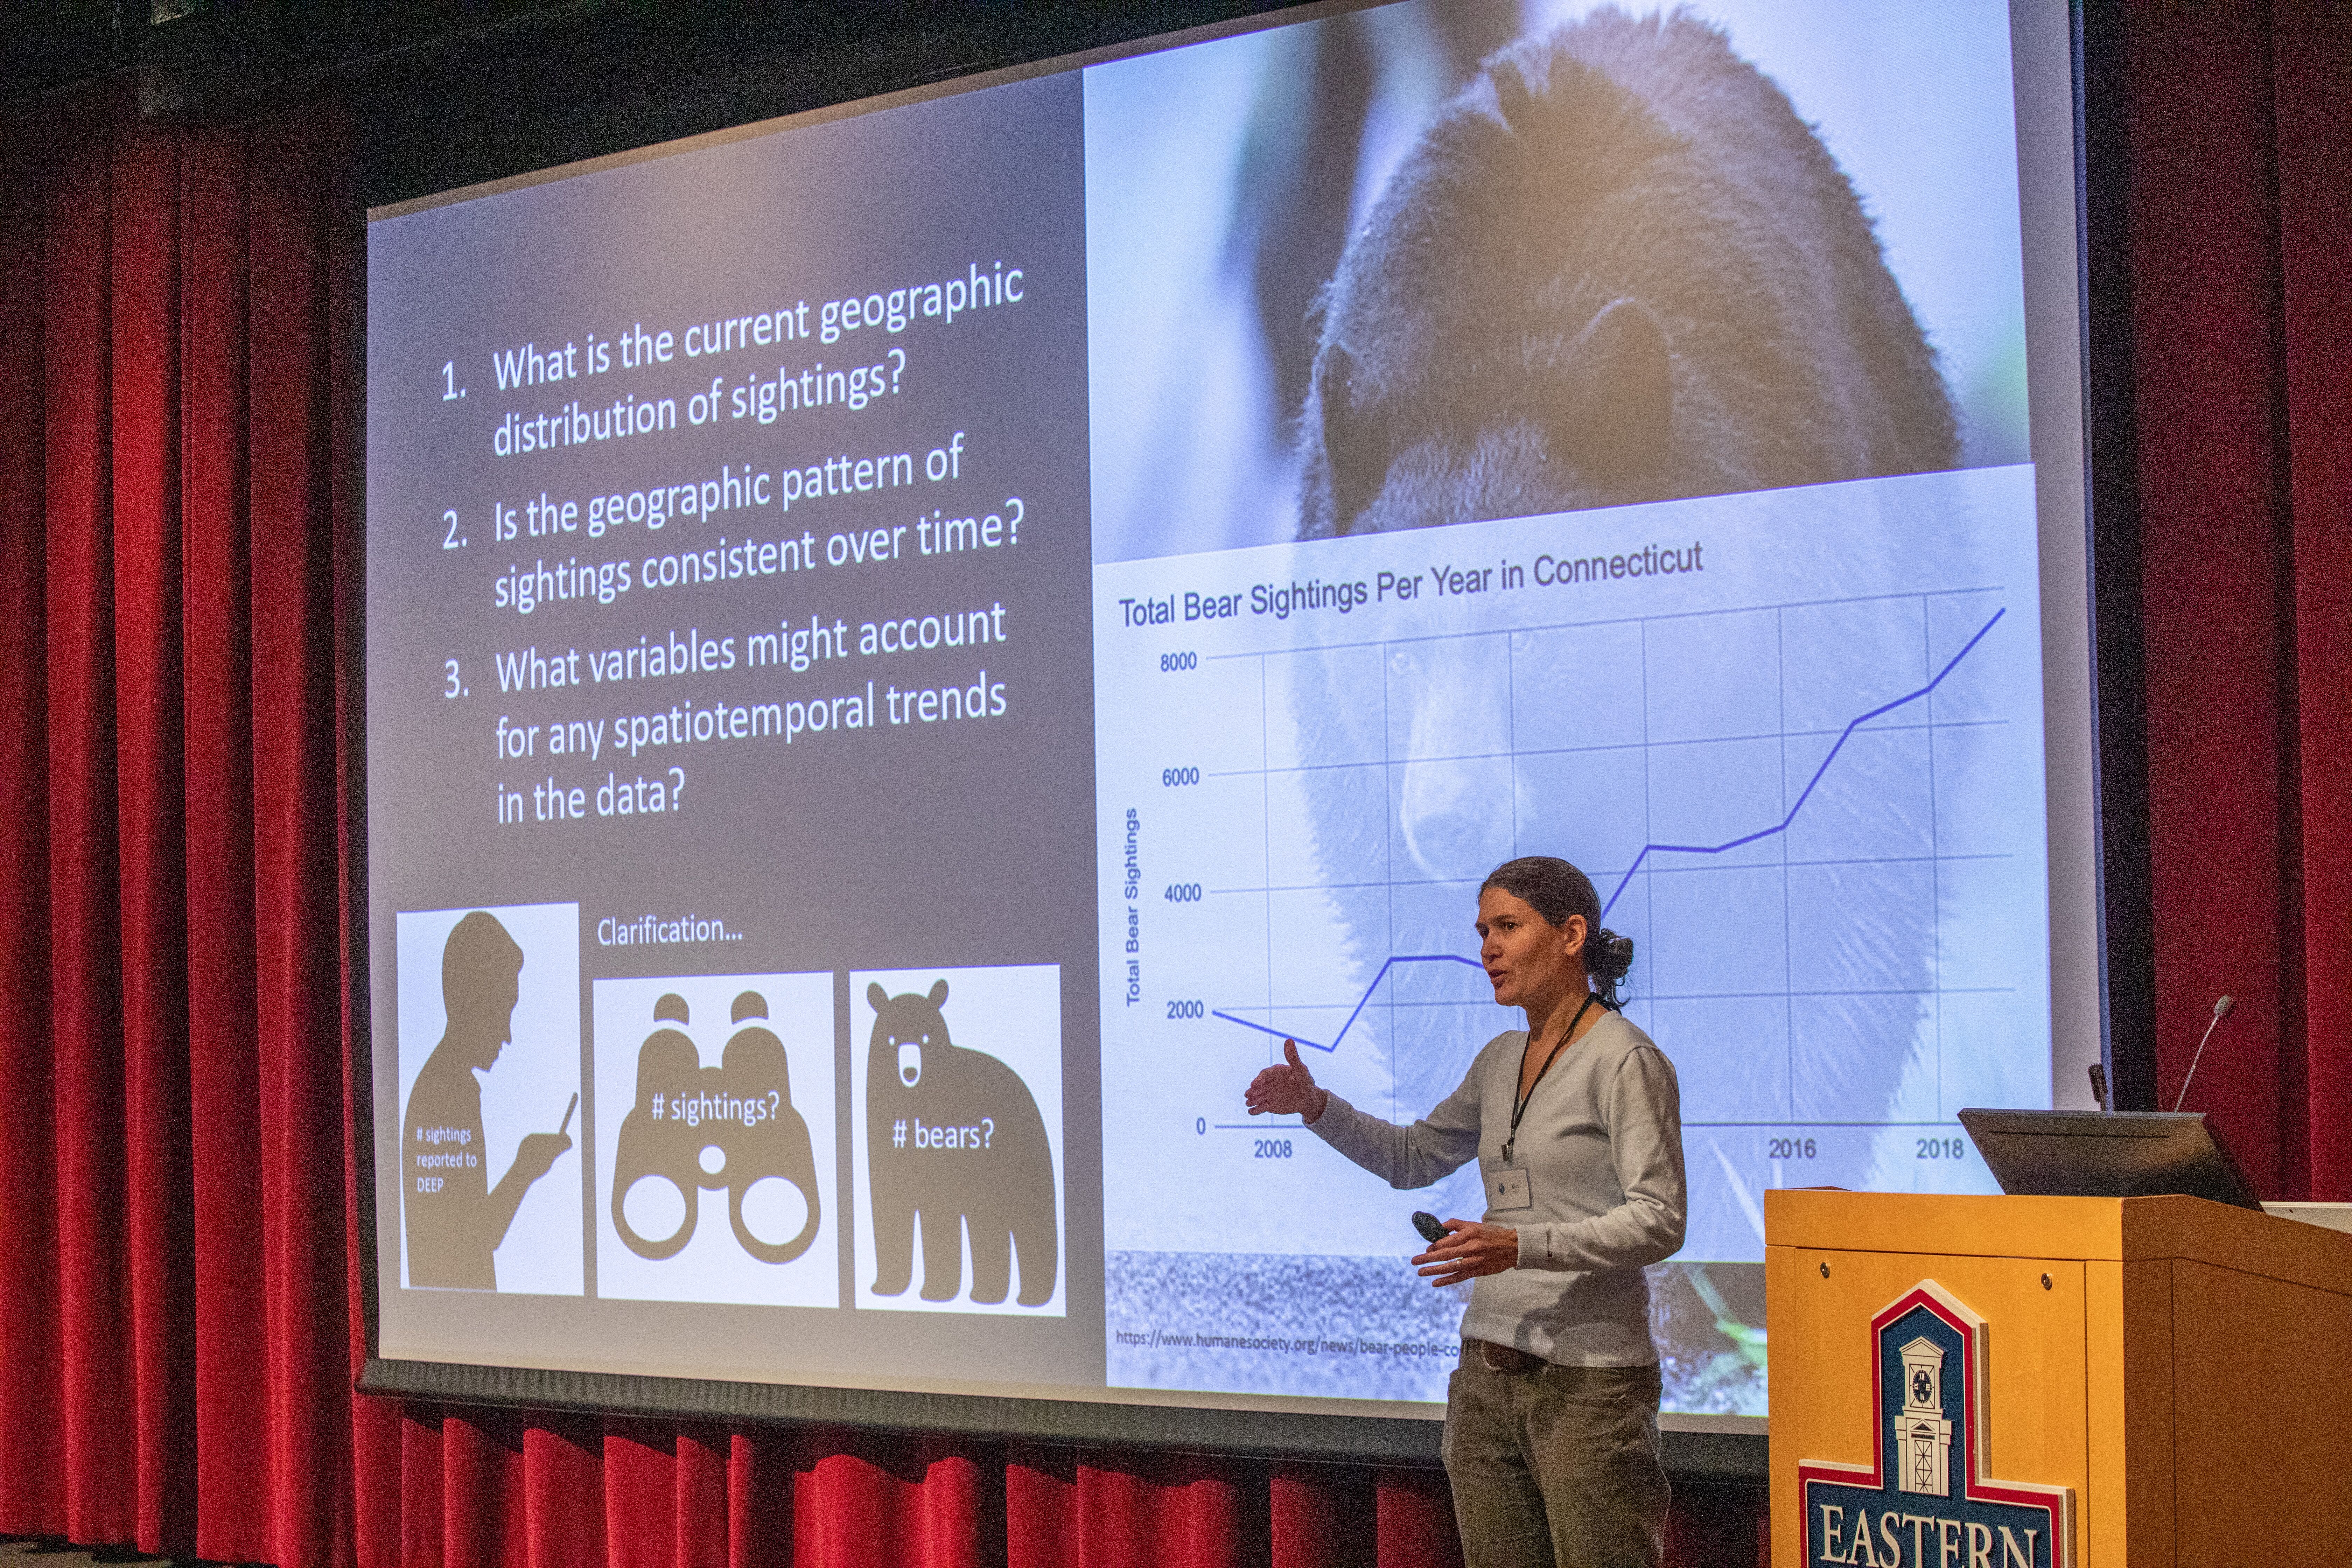
Kim presented work, in collaboration with her 14 E&ES 130 students, on spatiotemporal patterns of black bear sightings in Connecticut. Read an article about the GIS Day event or visit the CT GIS Network website.
Wesleyan GIS Day – Monday November 11
Celebrate GIS Day on November 11! Join the celebration of geography, mapping, and spatial data analysis at the annual GIS Day on Monday, November 11, 2019. Many Wesleyan faculty, students, and staff apply geographic information system (GIS) technology to their geospatial data visualizations and analyses. Come learn what GIS is and what it can do … Read more
Hands-on Activities at Wesleyan GIS Day
Campus tree mapping Treasure hunt Geocaching Where are Wesleyan’s favorite bathrooms?
Diver and Raby highlighted in Wesleyan Univ Magazine
Read the article